by Team Avista
Share
by Team Avista
Share
")
Marketing and public relations sometimes suffer from a bit of a credibility problem. Unscrupulous marketers have made consumers skeptical about if marketing messages are conveying the truth or think that public relations is being used to paint issues in a better light and omit the full story. How can this be overcome? How can we show that the work we do has truly positive outcomes? We can use the cold-hard facts to show how we help small businesses grow, get employees to become thought leaders, and even how we help spread important information.
By using data and statistics, we can show how credible our profession is, as well as how honorable we as professionals are. According to a recent Marketo report, “78% of B2B marketing executives use metrics that matter to the CEO and CFO.” Metrics are how you prove to your clients the work you’re doing has pay-off (either currently or in the future). What metrics matter most to them? Well, it depends on the client and the type of work you’re doing. But one thing is for certain – analytics should be at the core of every marketing and PR program. Here are some of the top ways to use analytics to build credibility for your programs.
Set your goals
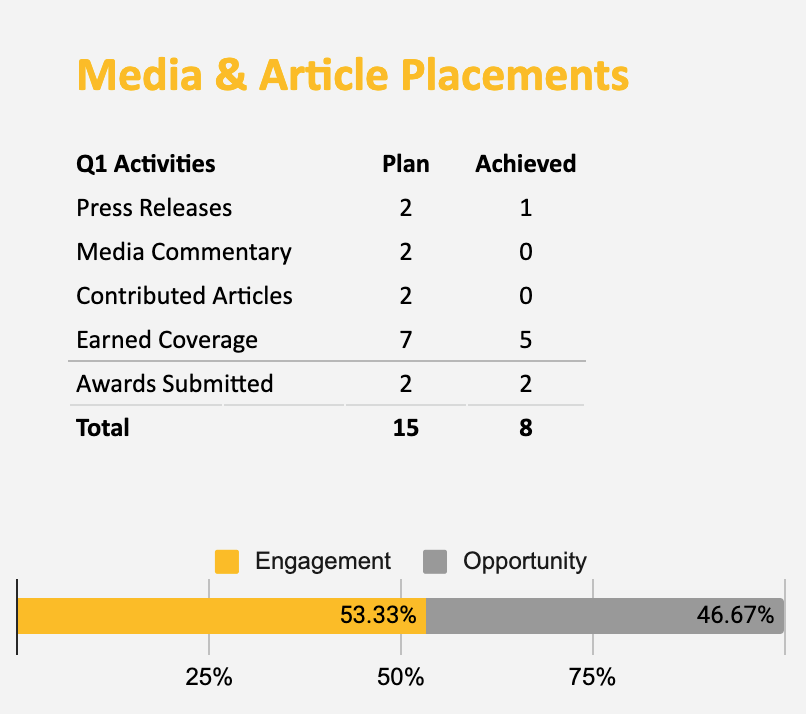
This might seem a little reductive, but take the time upfront to establish your goals with your client. You want to start off on the same page, so you can show how you’ll help them grow. Really consider the details as you map this out. This also helps in case they turn around and ask for more right before a cutoff.
Decide if you’ll measure monthly, quarterly, or yearly. Different clients might require more or less work in the time frame. Quarters are most typical for tracking and analytics. It’s also helpful to have these goals written out, and even illustrated somewhere. This way they can be easily updated and viewed by your team and the client. See the image below for an example of how to measure your goals.
Use a dashboard
Organization is absolutely vital in marketing and public relations work. By using some sort of dashboard, you can keep all of your client information in one place, and even grant them access to view or edit. Firms will choose different forms or styles of dashboards, so there’s no one “right way” to create them. As long as you have a space where you can monitor your movements, and add in your analytics, you’ll be set.
Metrics reports
We recommend creating and presenting either monthly or quarterly metrics reports. Depending on what all you do for your client, include graphs and images to showcase positive growth. You can also include other data points that show mobility and the benefit of your work (see image below). Even if social is something you regularly do for them, sometimes seeing the amount of times you’ve posted, the social cards you’ve created, and even the amount of time you’ve spent on their various accounts helps to put some specificity and validity to your general “social posted for the week” message.
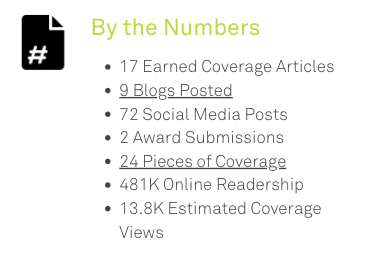
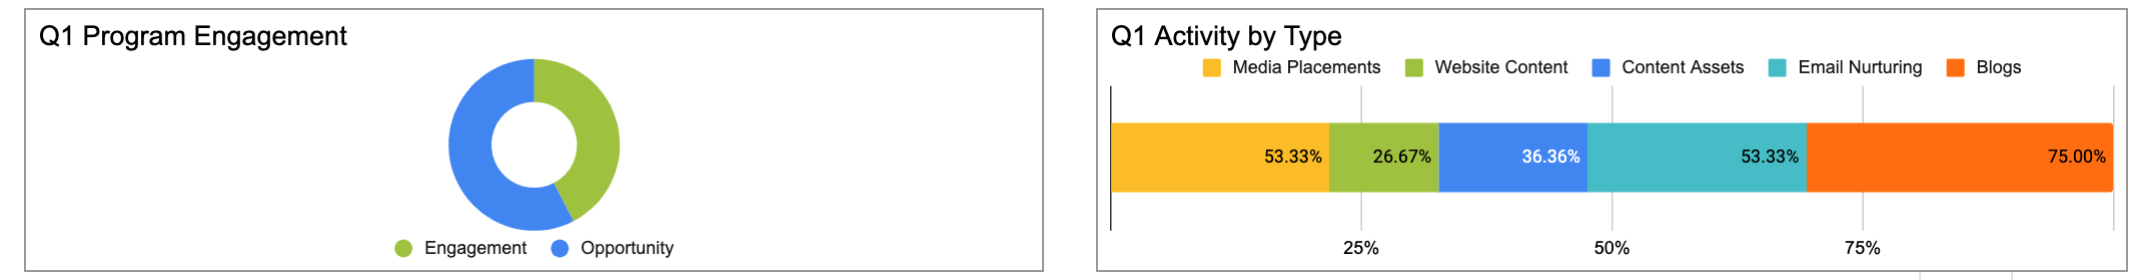
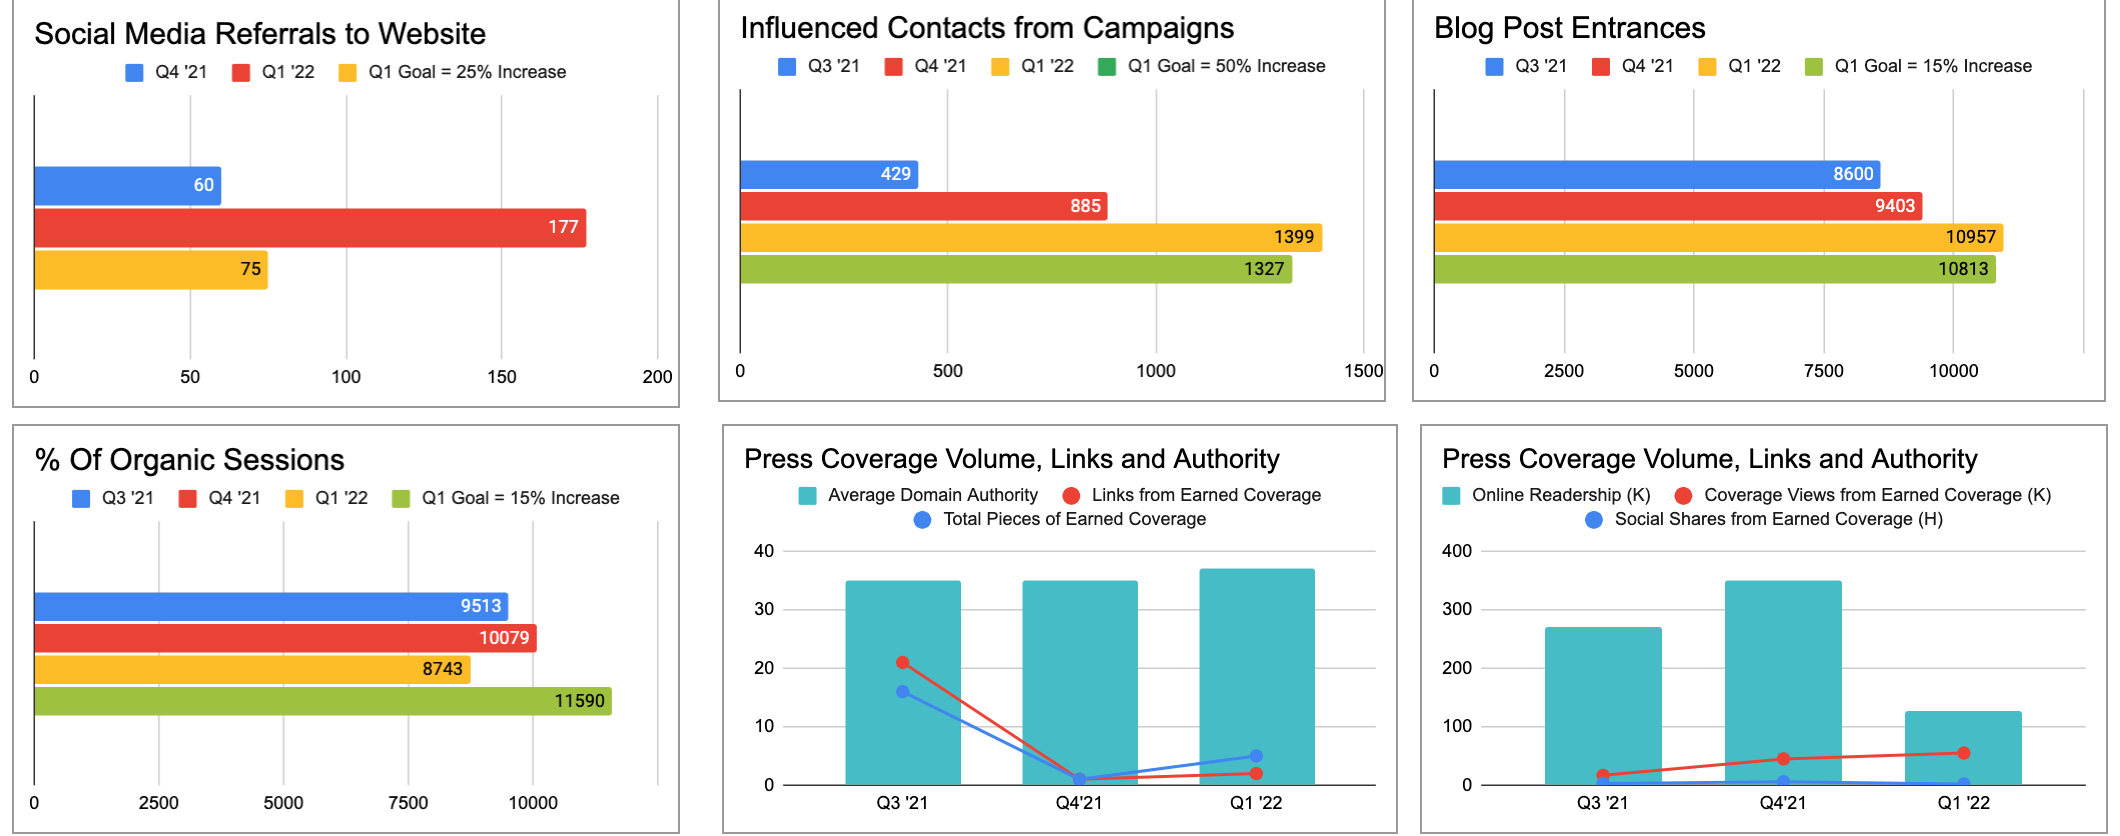
Oftentimes, you can “kill two birds with one stone”, by using your dashboard as the home for your data. You can pull from the goals you’ve set, as well as what you’ve achieved, to create graphs and visual elements for your metrics report. We recommend showcasing not only all that you’ve achieved, but also highlighting how that work has created growth. For example, create graphs that might show referrals, readership, or views. Below, we’ve included examples that show how important it is to create a metrics report that accurately shows both work and growth.
Monthly reports might be too frequent, with not enough data available to show growth, so showcasing your data quarterly is typically a good rhythm to set. These reports can be done however you choose; they don’t even need to be that fancy, or take a long time to make. As long as you have a way to present data and easily showcase growth, your clients will be happy. Set up a template, choose which data you will be showcasing for each report, and then pop in the numbers whenever it’s time.
Analytics tools
There are many tools available for marketers and public relations professionals to use to create analytics reports or track data. Google Analytics is one that is consistently on the rise. In a Trendkite report all about the platform, they share that “82% of all websites use Google Analytics to measure, learn, and grow.” They also discuss how the platform “shows who’s coming to your website and what they’re doing once they get there. The most important capability of Google Analytics is its ability to measure ‘goal conversions’.”
By using analytics tools, you can both show growth, but also learn from your work. See a blog on the website with very few views? You can study it to see where you went wrong. Maybe it needs a different title, maybe it doesn’t have the appropriate calls to action to bring in new viewers. By taking the time to study your metrics and data, you can improve upon your own work. Providing analytics is also important for your client to know what you’re doing. These numbers add some validity to your work. It’s so easy for clients to only see the bill they’re paying, and wonder what all of their money is going towards. Analytics platforms, and reports help showcase that even if they aren’t fully seeing the benefits of what you’re doing just yet, there is growth and increase.
Knowing which platforms can perform what, as well as how they might serve you and your clients, is extremely important. Some clients might need a tool that better monitors their social media presence, while another will need one to monitor their PR articles and commentary. Take time to test platforms and see which might be the right fit for your firm and your clients’ needs. There are so many ways to do analytics. It just takes time and effort to sort through the data and choose what metrics are most important to track and show. Contact us if we can help you build your personal analytics.
STAY IN THE LOOP
Subscribe to our free newsletter.
Related Posts

Today, newsrooms are leaner, deadlines are tighter, and the pressure […]

For years, B2B marketing has relied on a familiar formula: […]

As the marketing landscape continues to waver in strategy and […]

As AI adoption accelerates, traditional Google SEO is rapidly losing […]